Figure guide
How to make figures for lab papers, posters and slides. The other templates are on the Resources page.
Start from the style file
Download moose.mplstyle and load it before plotting:
import matplotlib.pyplot as plt
plt.style.use("moose.mplstyle")
It sets Arial at 7 to 8 pt, thin axes with no top or right spine, a colour-blind-safe colour cycle and PDF output with embedded fonts. Matplotlib's style sheet guide explains how to change any setting.
Size
| Use | Width | Text size |
|---|---|---|
| Single journal column | 3.5 in (89 mm) | 7 to 8 pt |
| Double journal column | 7.0 in (180 mm) | 7 to 8 pt |
| Slide, one figure | about 10 in | 18 pt or larger |
| Poster panel | 12 to 14 in | 24 pt or larger |
Make each figure at the size it will be printed, so the text comes out the size you chose. Check the journal's own limits before you submit.
Colour
- For data, use the Okabe-Ito colours in the style file. Readers with colour-vision deficiency can still tell them apart (background). For continuous values, use viridis.
- Do not tell series apart by red against green alone. Add line style, markers or direct labels.
- Keep lab green (
#00664F) and mint (#6ECEB2) for slide and poster design, not for data series.
Content
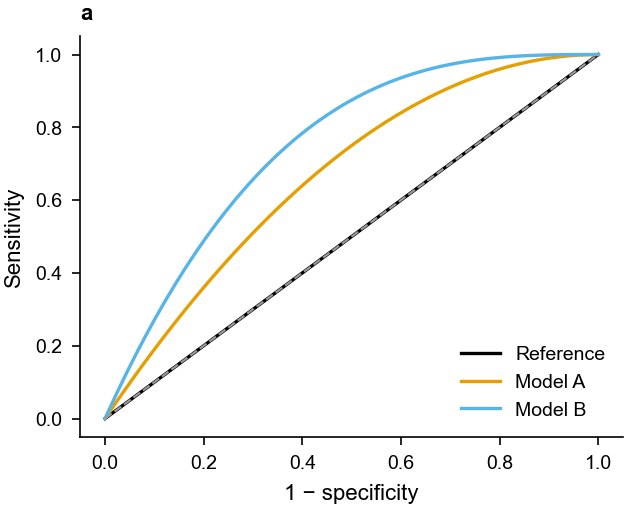
- One message per panel. Label panels with a bold lower-case letter (a, b, c) at the top left.
- Label axes with units, for example "Central corneal thickness (µm)".
- Show uncertainty (95% CI or the spread across folds), and say in the caption which one it is.
- Captions name the cohort and its size, explain the legend, and define every acronym.
- Draw each paper's diagrams new. Do not reuse an identical schematic across papers.
- Save as vector PDF or SVG. Use PNG at 600 dpi only for photographs and images.